Mission critical systems are complex, interconnected beasts with multiple layers of technology keeping the whole show running. Understanding the relationships between components and the impact of latency, can be a difficult and time consuming task.
Typically we need to observe application, database, host, network, storage and hypervisor metrics to understand system behaviour. This can be tricky when your monitoring tool does not have a rich dashboard interface available, or you need to pull metrics from multiple sources to have the complete picture of your system.
The Monitoring Challenge
We have experienced this challenge first hand. Monitoring platforms are often great at monitoring but may not provide rich dashboards or analytic interfaces used to provide a quick overview of system components.
Analytic and reporting tools that provide rich interfaces are fantastic at visualising data, but can be limited by the depth of metrics required to diagnose problems.
CheckMK + Grafana = Best of Both Worlds
So how to solve this problem? We have done this by using two best of breed tools:
- CheckMK is our monitoring platform that also collects and stores rich metrics for all monitored services.
- Grafana is our dashboard and reporting platform.
The “magic” that glues these two applications together is the Grafana data source provided by CheckMK. This enables Grafana dashboards to report on any metric stored by CheckMK – both real time and historical metric data.
This solution becomes more powerful when you add additional data sources to the Grafana dashboards. Data from other data sources (Postgres, Oracle, InfluxDB) can also be used with CheckMK metrics to provide powerful reporting capabilities.
The Problem We Had to Solve
To solve this problem we had a set of criteria for the tools we would use as a key part of our support business:
- Easy to deploy and support.
- Lightweight deployment that does not require a whole support team to keep running.
- Ability to monitor hardware, operating systems, databases, web servers, cloud environments.
- Cost effective.
- Integrates with our service desk and paging platforms.
- Supports hub and spoke or master-slave deployment options.
- Ability to customise or extend where required.
A broad list – but nothing uncommon for monitoring mission critical platforms.
After evaluating several tools – from open source through to commercial heavyweights – we selected CheckMK for our monitoring platform.
I will go into details of what CheckMK can provide in another post. In a nutshell, we were able to monitor and collect metrics on every layer of the technology stack running our customers and our hosted mission critical systems.
System metrics to operational insights
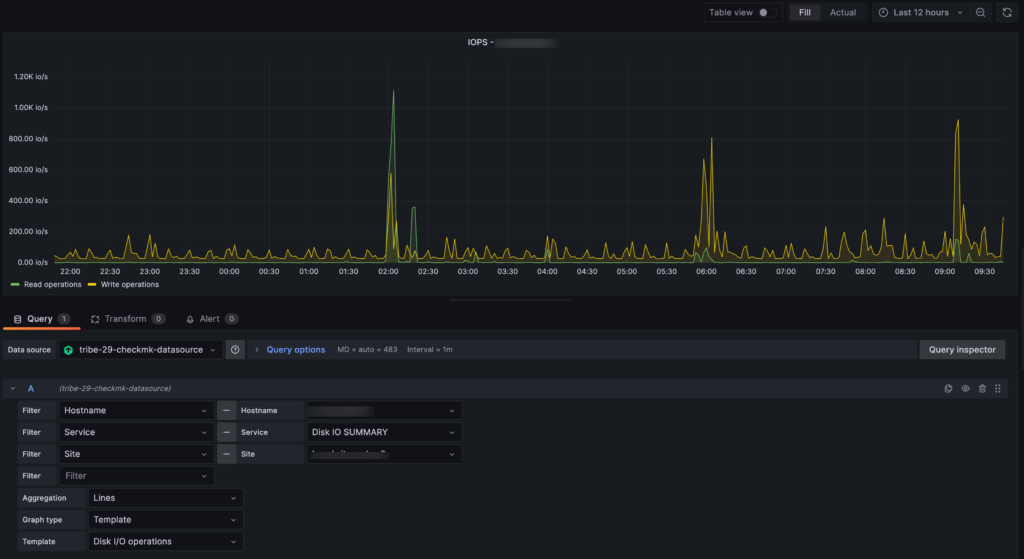
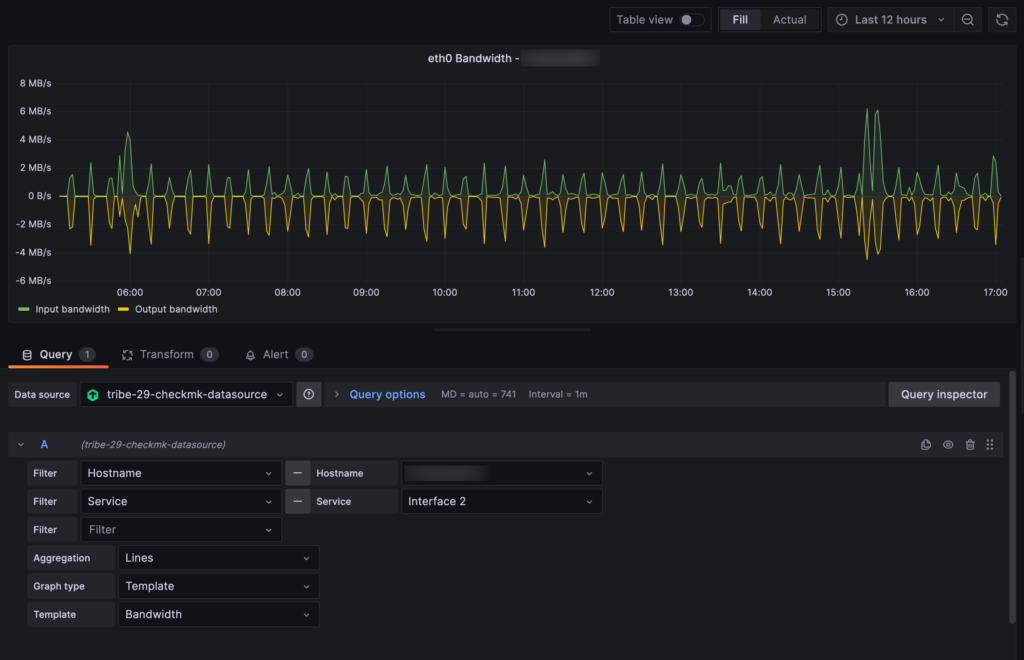
The CheckMK + Grafana data source allows the detailed CheckMK metrics to be directly viewed and analysed in Grafana. Quickly and easily.
After a one-time setup for the CheckMK data source in Grafana – CheckMK metrics are accessed via drop-down lists in the Grafana query page.
Where to start
One thing to keep in mind with this approach is that there is almost too much data available to analyse! CheckMK collects and stores a vast amount of system metrics.
Our approach has been to have a set of dashboards that answer questions at different layers of the technology stack. For example we have the following dashboards defined:
- Host Overview
- Database Overview
- Host CPU
- Host Network
- Host/Database Storage
- Database Workload
The dashboards are developed as a drill-down hierarchy with lower levels of the hierarchy reporting on more detailed metrics.
How we use it
We use the CheckMK/Grafana platform to place context around a problem or provide an overview of system behaviour at a point in time. This tool is not a replacement for capturing or analysing database trace files, java heap dumps or software specific diagnostic tools.
It is fantastic for helping answer the following types of questions:
“My report ran slow this morning from 06:00 – 07:30, is there a problem with the system?”
“How much memory and CPU headroom do we have if we run on a single server?”
“What are our CPU, memory and disk IO peaks over a month?”
“What is the storage and network load on the infrastructure during the database backup window?”
“What virtual machine is consuming the most storage bandwidth?”
Some of the above questions can be answered completely with CheckMK/Grafana. Some of them will provide insights to system behaviour during problem diagnosis and help guide the resolution.
Interested in how you could benefit from this solution? Get in touch with us here.