Why Monitor your Audit Trail?
Raw database audit information provides details of how sensitive data is accessed in your system, but offers little insight to the patterns and behaviour behind how that data is used. Kind of like an accountant trying to gain insights of financial health by trawling through general ledger journal entries. An impossible task.
Financial analysts obtain insights into raw financial data by using BI and analytics tools.
We have powerful capabilities to take a similar approach with database audit information using log management tools. These tools can provide insights to how sensitive data is accessed and manipulated – along with capabilities to notify us when suspicious access occurs. They are part of an overall strategy to protect your critical data through database hardening.
In this article we discuss using Graylog for Oracle Database audit collection. The concepts discussed can easily be used for any on-prem or cloud database platform that provides an audit trail.
Why Graylog?
There are many log management tools in the market that provide similar capabilities – Splunk, Datadog, New Relic etc. The principles and concepts discussed in this article can be adopted to all of these tools.
For us, we have found Graylog to offer great capabilities at a great price – but also have the option to scale up when required.
Graylog provides powerful log collection, storage and analytics capabilities along with alerting for specific patterns of data access. Graylog can also be integrated within your existing log management and SIEM solutions.
In this article we are going to cover how Graylog can be used to provide insights to your audit data in an Oracle environment.
Graylog Database Sources
The richer the audit data the more insights we can obtain around how the data is used. We use both Oracle Standard Auditing and Oracle Fine Grained auditing as audit sources.
Oracle Standard Auditing provides audit data for activities across the database and provides powerful capabilities to track changes and access to your system.
Oracle Fine Grained Auditing provides audit on specific columns and data within the database. Oracle FGA allows us to “enrich” our audit trail by excluding audit records being generated for “trusted” access.
When used together, these audit features provide a powerful combination to report on how your database is accessed along with answering who, what and how privileged data is accessed.
Extracting Oracle Auditing Data
Audit log extraction to Graylog is performed by Logstash over a JDBC connection to the database. Logstash provides data extraction and pipelining functionality along with being simple to implement and maintain. We configure Logstash to output the Graylog native log format – GELF – directly to a Graylog input.
Logstash can be configured to run multiple scheduled jobs to extract different audit data. We typically have the following setup:
- Database audit record extraction from DBA_AUDIT_TRAIL runs hourly. These are audit records to collect historical activities on the database.
- Suspicious audit extraction – these are audit records that are generated from “suspicious” database activities. Failed logins, privilege escalation via role or system privilege grants are examples of the type of audit records captured in this job. Scheduled job every 1-5 minutes.
- FGA audit records – extract all FGA audit records every 15 minutes. There are no filters on this extract.
- FGA audit sensitive data – every minute.
We can customise the type of audit extract and frequency to match our requirements. Typically we have audit data that is generated from the most sensitive activities being extracted more frequently than other audit data types.
Logstash performs the transformation and transmission of the audit data into Graylog in near real time. Audit data is selected based on the last_run_metadata_path value stored by Logstash for each audit input type.
Graylog Audit Trail Analysis
Once the audit records are in Graylog we can generate reports from the audit data. An example of the type of reports we have are:
- User logins and login locations.
- Privileged actions.
- Database changes and modifications.
- Sensitive data access.
Report subjects are determined by the audit policies that are implemented. Make sure that your audit policies match the data requirements for your reporting.
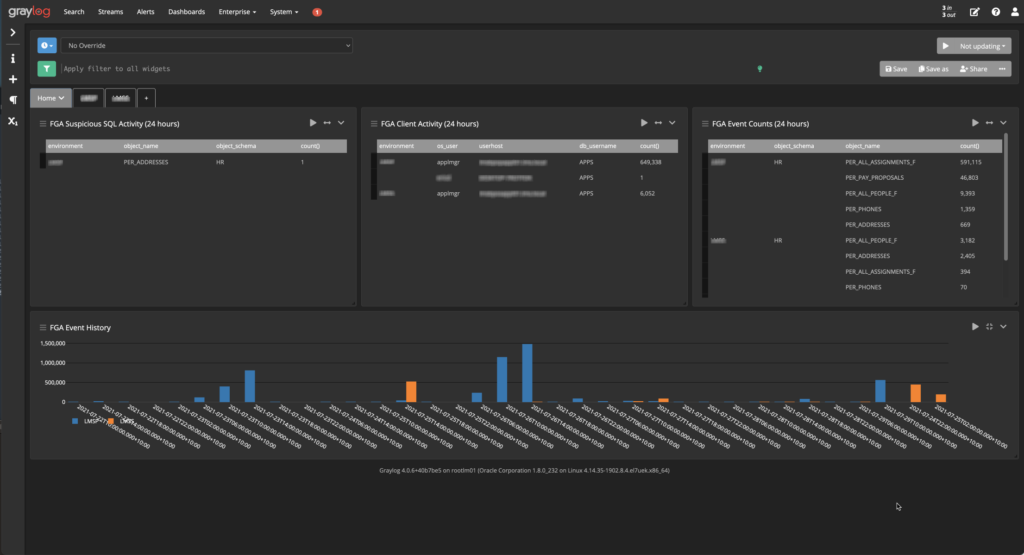
Graylog allows you to generate custom dashboards and reports that can contain whichever reporting elements you require. We typically use table widgets to report on database login activities, graph widgets to report on aggregates and trends across the audit data.
We use the dashboard and reporting features of Graylog to provide insights to how the system is accessed and review the types of activities happening around the database. In some cases the reports not only answer questions from a security perspective but help the operation of the system overall. In one case, an application was made significantly more efficient by using a connection pool instead of opening and closing a database connection for each batch load. The Graylog reports on the audit data had highlighted an unexpectedly high connection rate for a particular user in the database, prompting further investigation as to why the connections were so high for that user.
Alerting Suspicious Events
Graylog provides powerful alerting capabilities that integrate with many applications – PagerDuty, Slack, Teams and email. Using a combination of Pipelines to filter and enrich data along with alerting events – you can setup a monitoring framework that can alert on a single event, or a pattern of events.
We have single event alerts configured for a failed database login to a schema that we know has sensitive data. We have pattern alerts configured where a series of events over a given timeframe would be of interest to us.
For example, the following combination of activities would be regarded as suspicious:
(multiple database accesses for a specific database user) + (from a client on a specific network range) + (issuing a certain type of query ie..SELECT * from SENSITIVE_DATA)
Would be something we trigger an alert on. Individually those actions may not be suspicious – but combined they match the profile of suspicious activity. High priority alerts are notified in real time via PagerDuty, Slack and email to the relevant support team.
Summary
We have only touched on the features available on the Graylog platform for a specific use case. The capabilities provided are a critical part in being able to extract value from audit data by making it easy to report and act on. Book an appointment with our team to learn more how this powerful tool can be used to protect your most critical data assets.