 Mark Burgess
We built the OCI plugin for Checkmk because we run Checkmk across every environment we manage and did not want a separate monitoring stack for the Oracle Cloud part of it. It has run against our own managed-service tenancies for over a year and a half and has been open source, GPL-2.0, on GitHub and the Checkmk Exchange since July. There’s an overview of what it does on our Checkmk for OCI page; this post is the engineering behind it. What follows is what we learned building and running it, written for someone about to point Checkmk at an OCI tenancy who wants to get the structure right first time.
The OCI Monitoring documentation explains the metric namespaces, the alarm model and how to query metrics. The Checkmk documentation explains how a special agent, the check API and rulesets fit together. Both are good at what they cover. This post covers a different question: which signals from an OCI tenancy matter operationally, and how to lay the monitoring out so that what lands in Checkmk is useful rather than just a long list of services. The plugin is the worked example; most of the decisions apply whether you use it or build your own.
Here’s what matters.
Decide What a Control-Plane View Is For
The first decision is scope, because it shapes everything else.
OCI Monitoring collects performance metrics from services and raises alarms on them. The plugin does something different. It reads the control plane: lifecycle state, configuration, backup and replica posture, load balancer health, the tenancy’s cost run-rate, and what Oracle is telling you about your regions. It issues list_, get_ and request_summarized_usages calls and nothing else – never the Monitoring metrics API, and never anything that changes state.
That’s a scope decision, not a view that metrics don’t belong in Checkmk. Performance metrics are a different stream with a different transport, and we’re bringing them into Checkmk through the OpenTelemetry collector in Checkmk Ultimate so OCI metrics sit alongside everything else in near real time – that’s separate work and a later post. What the plugin covers is the half a Checkmk operator usually has no view of at all. A stopped instance that should be running, a volume whose last backup is two days old, a cross-region replica that has quietly stopped syncing, an Autonomous Database in AVAILABLE_NEEDS_ATTENTION, a compartment whose spend has crossed the line you set – none of those are performance metrics, and none appear in the console unless someone goes looking.
If you already run the Checkmk agent on your OCI compute hosts, or the Checkmk Oracle plugin on Base Database Systems, keep doing so. The plugin adds the tenancy-level view around those hosts; it doesn’t replace what runs inside them.
Treat state and configuration as one stream and performance metrics as another. The plugin is the first; OTel is how the second arrives.
What the Plugin Covers
The plugin is a Checkmk special agent. Nothing is installed inside the tenancy; the site authenticates with a read-only API key and the checks run on the Checkmk server. It works on Checkmk 2.3 and later on every edition including Raw, and has been tested against 2.4. The oci Python SDK isn’t bundled with Checkmk and has to be installed into the site’s Python – the README’s installation and quick-start sections cover both.
Each service family is a separate toggle in the rule:
- Compute – lifecycle state, shape, OCPUs and memory, attached block and boot volumes, cost per instance.
- Block and Boot Volumes – size, VPUs, latest full and incremental backup timestamps, cross-region replica state and sync gap.
- Volume Groups – group state, backup policy assignment, coordinated backup age, replica state and sync gap.
- File Storage – state, size, metered usage and cost, replica sync.
- Object Storage – bucket size, object count, replication policy, storage tier (metadata only; object contents are never read).
- Load Balancers – overall health and per-backend-set health, naming the backend sets in warning or critical.
- Oracle Database – Base DB Systems (state, cores, storage, licence model, cost) and their databases (auto-backup configuration, recovery window, last backup duration, management status).
- Autonomous Database Serverless – ATP, ADW, APEX and AJD; state, compute and storage, auto-scaling, backup retention, Data Guard, mTLS, cost.
- Virtual Cloud Networks – VCN and subnet inventory with security-list resolution.
- Tenancy Usage – month-to-date cost for the tenancy and per service, with thresholds.
- Announcements and Region Status – the OCI Announcements service and the public region status page, each as a Checkmk service.
- Topology – network and resource datasets for Checkmk’s built-in topology viewer.
Resources Become Piggyback Hosts
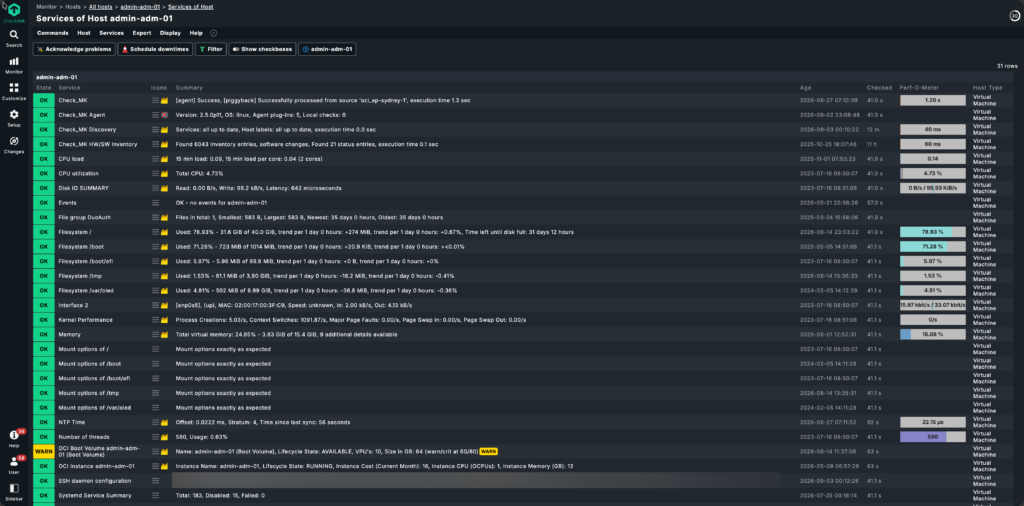
Compute instances, databases, load balancers, file systems and volume groups are emitted as piggyback hosts named after the resource, so an instance called admin-adm-01 becomes a Checkmk host of that name. If the Checkmk agent already runs on that instance under the same name, the OCI services simply join the OS services on the existing host. Autonomous Databases are named <db_name>-<region> because the same database name can exist in more than one region.
Each piggyback host also carries host labels: oci_service_type on everything, plus workload and database-name labels on Autonomous Databases. This is the part we use most outside monitoring. Checkmk is the dynamic inventory for our Ansible runs against OCI, with fleet jobs targeting hosts by label straight off the monitoring data. The plugin stays read-only; Ansible does the acting, and that separation is what keeps the monitoring credential at inspect-and-read.
Aggregates Go to the Inventory Tree
Per-region and per-compartment totals – instance counts, running versus stopped, OCPUs, storage, cost – are written to the HW/SW inventory tree under OCI/aggregates/ rather than emitted as metrics. An earlier version produced a metric per region-compartment-service combination, which meant RRD files multiplying faster than anyone would look at them. Inventory gives you the same data for reports without the storage cost.
If a service family isn’t in the list above, the plugin doesn’t monitor it.
Authentication and Least Privilege
The plugin authenticates as an OCI user with an API signing key. That’s the only method it supports at present, so plan the identity side accordingly.
Create a dedicated user in a dedicated group, with no console password, so the credential can be rotated or revoked without disturbing anyone’s console access and the audit trail contains nothing but monitoring calls. Attach the policy to the group at the tenancy root, not to the user.
Three policy shapes work, and which one you use is usually down to your compliance requirements rather than anything technical.
The broad policy is three statements: inspect all-resources, read all-resources and read usage-report, all in tenancy. This is what most deployments should use and what the rule assumes.
The least-privilege policy grants read on exactly the service families the plugin touches (instance-family, volume-family, database-family and so on), plus inspect and read on compartments and inspect on tenancies. Any block whose service toggle you leave off can be dropped; the toggle-to-statement mapping is in the plugin’s IAM documentation.
The compartment-scoped policy restricts read all-resources to named compartments. Two statements stay tenancy-wide: read usage-report, because the Usage API doesn’t accept compartment scoping, and inspect compartments, because the plugin can’t walk a tree it isn’t allowed to enumerate.
The manage verb is never required. If a policy you have been handed contains it, the policy is wrong.
The user OCID, tenancy OCID and key fingerprint go through the Checkmk password store, so they don’t appear in process listings. The private key is a file on disk – the password store can’t hold a multi-line PEM – under the site user’s home, mode 600, distributed by whatever you already use for secrets. Treat it as an SSH private key.
For firewall allow-listing, the agent talks HTTPS on 443 to the per-service *.oraclecloud.com endpoints (identity, iaas, filestorage, objectstorage, loadbalancer, database, announcements) and to usageapi in the home region only. The region status check reads the public status page and needs no IAM at all.
Run the agent by hand as the site user before you touch discovery. Each failure has a signature. 401 NotAuthenticated: the private key doesn’t match the public key on the user, or the fingerprint is wrong; regenerate the fingerprint locally and compare. 404 NotAuthorizedOrNotFound: the policy isn’t attached, or is attached at the wrong level; check it’s on the group at the tenancy root. 429 TooManyRequests: a rate limit, covered below. The log is var/log/agent_oci/special_agent_oci.log under the site. Fix authentication there first – discovery won’t tell you anything the log hasn’t.
Compartments, Regions and Discovery
By default the plugin monitors every compartment under the tenancy root in every subscribed region, which is usually what you want. When it isn’t, the filter semantics matter, because getting them wrong doesn’t fail – it silently monitors less than you think.
The compartment filter is a comma-separated list of compartment OCIDs or names, matched exactly and case-sensitively against both. A name used on more than one compartment matches all of them – handy when that’s what you want, a trap when it isn’t. Use the OCID to disambiguate. Sub-compartments aren’t included automatically. If you want Production and its children, list each child.
The diagnostic signature of a wrong filter is a warning in the agent log – Compartment filter entry matched no compartment – and a host with fewer services than you expected. Nothing turns red. Check the log the first time you apply a filter, every time.
Regions work the same way. Leave the region list empty and the plugin discovers subscribed regions from the tenancy; specify a list and any entry that isn’t subscribed is skipped with a warning. The home region is always required, because that’s where the Usage API lives.
Regions are processed in parallel, each worker writing to its own buffer, with the buffers written out in stable region order once every worker has finished. Letting threads write to stdout as they go interleaves piggyback headers and produces output Checkmk parses into nonsense. The rule exposes the worker count, default four.
Discovery itself is ordinary Checkmk. Assign the rule to a host representing the tenancy, activate, run service discovery. Tenancy-level services land on that host; resource-level services land on the piggyback hosts. In a distributed setup the oci SDK has to be installed on every site that executes the agent, not just the central one; that’s the usual reason a remote site’s OCI host shows nothing.
The Cost of Polling
An OCI tenancy isn’t a server. Every check cycle is a set of API calls against a rate-limited, sometimes slow control plane, and most of the plugin’s design is about keeping the number of calls down.
Cache by How Often the Data Actually Changes
The plugin uses tiered cache TTLs based on how often the underlying data can change. Resource lists refresh at the default five minutes, backup information at twenty, per-resource cost hourly. Identity-layer data – compartments, tenancy metadata, region subscriptions – and backup policy assignments refresh once a day, because they change on the order of days or never. Tenancy-wide usage also refreshes daily, because the Usage API’s own data updates roughly once a day and polling faster returns the same numbers.
The failure you’re avoiding is an agent that hits the Identity API for the full compartment tree on every run – on a large tenancy, the difference between an agent that completes and one that times out.
Fetch Cost in Bulk
Cost attribution is the expensive part. One Usage API call per resource is a few hundred calls on a modest tenancy against an API with a low quota. The plugin instead makes one tenancy-wide call grouped by resourceId, indexes it by OCID, caches it for an hour, and looks each resource up in the index.
The catch is that a group_by resourceId query omits resources with no billable cost – free tier, just created, or merged into another dimension. For those the plugin falls back to a per-resource query and caches the answer individually. A resource reporting no cost is usually a genuine zero, not a lookup failure.
Bound the Retries
The OCI SDK’s default retry strategy is generous. When a service returns HTTP 500, exponential backoff can consume more than a minute on a single call, and an agent making many calls will blow through Checkmk’s agent timeout long before OCI recovers. The plugin overrides this with two attempts and decorrelated jitter between one and ten seconds, retrying on 429 and any 5xx, with ten seconds to connect and thirty to read.
The OCI APIs are rate limited – the Usage API in particular has a low per-tenancy quota in the home region, and the plugin is built to touch it rarely: the agent runs every minute on the normal Checkmk schedule, but the caching is what decides how often OCI actually gets called – resource lists every five minutes, the bulk per-resource cost index once an hour, tenancy and per-service usage once a day, and everything in between served from cache. If you see persistent 429s in the log, reduce region parallelism first, then check whether something else is also polling usage.
Paginate Everything
Every list_* call goes through the SDK’s pagination helper. The default per-call limit on most OCI list endpoints is around a hundred items, and an unpaginated call returns the first page with no error. The signature is a compartment where resources beyond the first hundred never appear in discovery.
Run Once, Not Twice
A full fetch over two regions took roughly forty seconds in our environment. Checkmk’s automation helper runs a small number of workers, so a GUI discovery preview racing the scheduled check can tie up every helper on duplicate OCI traffic and produce “Could not connect to automation helper” errors that look like a Checkmk fault. The plugin serialises identical invocations with a lock: a second caller for the same scope gets the previous run’s cached output.
Poll less than you think you need to. The data doesn’t change as fast as a server’s does, and every call counts against a rate limit – Oracle doesn’t charge for API calls, but it does throttle them.
Thresholds: Start From the Service’s Own Failure Modes
The plugin ships with default thresholds, and they’re placeholders. What matters is the model behind them, the same across every check: map lifecycle state to Checkmk state according to what the OCI service itself considers healthy, treat configuration as something you assert rather than observe, and use time-since as the signal for anything that’s supposed to recur.
Lifecycle State Is the First Result
Every resource check yields lifecycle state first, and the mapping is service-specific. An Autonomous Database in AVAILABLE or STOPPED is OK; FAILED, TERMINATED, INACCESSIBLE and AVAILABLE_NEEDS_ATTENTION are CRIT; transitional states – PROVISIONING, SCALING, UPDATING – are WARN so they’re visible without paging anyone. A stopped ADB is OK because stopping it is a normal cost-saving action and the check can’t know whether it should be running.
Compute instances take the opposite approach: the rule carries an expected lifecycle state, default RUNNING, and any other state is CRIT, overridable per host for instances meant to be off.
The signature of getting this wrong is either a wall of CRIT from resources behaving as designed, or a resource that has sat failed for a week while the check reported OK. Read the service’s lifecycle states before you decide which ones are bad.
Configuration Is Asserted, Not Measured
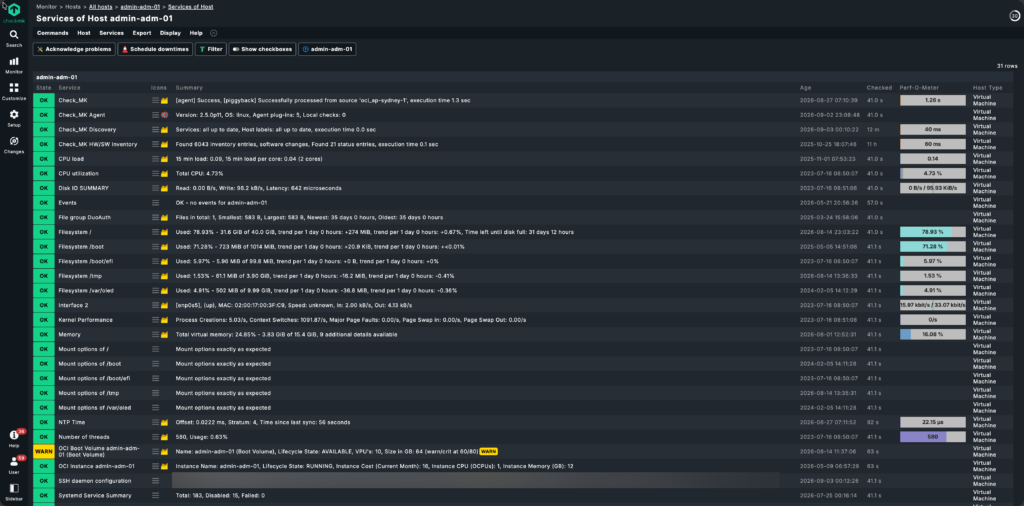
Several checks compare what OCI reports to what the rule says should be true: licence model on a DB system, workload type, Data Guard and mTLS on an ADB, backup deletion policy and full-backup day on a database, whether auto-scaling is enabled. A mismatch is WARN. These are drift detection: someone changes a setting in the console, the rule still says what the standard is, and the service stays yellow until one of them is corrected.
Set assertions for what your platform standard actually specifies and leave the rest at “no validation”. An assertion you haven’t thought about is a WARN nobody will act on.
Backups and Replicas Are Measured by Age
The shipped defaults reflect the cadence of the underlying mechanism. Volume group backups warn at 25 hours since the last backup and go critical at 27, assuming a daily policy. Volume group replicas warn at 5 minutes since last sync and go critical at 10. Block volume and File Storage replicas warn at 90 minutes and go critical at 120, because the sync cadence is coarser.
If your backup policy is weekly, the 25-hour threshold will page you every day and you will learn to ignore it, which is worse than no check. Set the gap to your policy plus a margin for the job to complete. A replica not in AVAILABLE state is WARN regardless of sync age; a replica that’s provisioning or faulty isn’t one you can fail over to.
Set Cost Thresholds Where You’d Want to Know
Per-resource, per-service and tenancy cost thresholds are month-to-date figures, and the shipped defaults are arbitrary. Set them at the level where you would want to know – for most teams a service or compartment budget, not an individual instance. A threshold crossing mid-month tells you the run-rate is wrong while there’s still time to act.
Autonomous Database and What Actually Matters
If you’re running Autonomous Database Serverless, the plugin is Checkmk’s control-plane view of it – and until the metrics stream lands, the only view. Monitoring is API based because there’s no host to install a Checkmk agent on to run the Oracle plugin, so the control plane is the whole picture, and it’s worth being precise about which of the many fields the API returns matter.
State comes first, with the mapping above. AVAILABLE_NEEDS_ATTENTION is the one to take seriously: the database is up but something requires action, and it’s easy to miss in a console showing green.
Storage is reported as allocated terabytes and as used percentage, the latter against 80 and 90 by default. Alert on the percentage: with auto-scaling it tells you the growth rate; without it, it’s your only warning before the database stops accepting writes.
Backup retention is checked with lower thresholds: warn below 30 days, critical below 7. It’s the one place in the plugin where a lower number is worse, because retention is a setting a well-meaning person reduces to save on storage without appreciating what it removes from the recovery window.
The assertion checks are where the value is for anyone running ADB to a standard. Expected workload type catches a database provisioned as ADW when the standard says ATP. Expected Data Guard state catches a production database whose standby has been disabled. Expected mTLS catches a database opened to one-way TLS to make a client work. Each is one rule setting, WARN on mismatch, and none is something the console will tell you unless you open the database and read the page.
For Base DB Systems the picture is split. The OCI plugin reports the system and the database’s OCI-managed backup configuration – auto-backup enabled, deletion policy, full-backup day, recovery window, last backup duration. The Checkmk Oracle plugin on the DB host reports everything inside the database. Run both; neither is complete on its own.
Monitor ADB for state, storage percentage, retention and drift. Everything else is inventory.
The Bottom Line
OCI already has a metrics service. What it doesn’t have is a place where the state, configuration, backup posture and cost of a whole tenancy sit alongside everything else you monitor, with thresholds you own. That’s the gap the plugin fills. The design choices – read-only credentials, tiered caching, bulk cost lookup, bounded retries, labelled piggyback hosts – are what make it cheap enough to run on Checkmk’s normal one-minute schedule.
Get the identity right and prove it from the command line before you go near discovery. Set thresholds from what the service itself treats as unhealthy rather than from the defaults, and poll less than you think you need to – the control plane is rate-limited and the data doesn’t move fast.
Source and documentation are at github.com/burgesssystems/agent_oci; the MKP is on the Checkmk Exchange.
Need help monitoring OCI with Checkmk?
We built the plugin and we’ve run it against the tenancies we manage for over a year and a half. The plugin is free and stays free. What we add around it is the Checkmk subscription and support – we’re a Checkmk Gold partner – and the OCI side: getting it deployed and tuned against your tenancy, wired into your alerting, or looking after the platform itself.
A 30-minute call is usually enough to work out which of those you need. You’ll be speaking with a senior consultant, not a sales rep.
Book a 30-Minute Call