 Mark Burgess
These lessons come from years of deploying and running Checkmk in production – greenfield builds, distributed setups across large network estates, monitoring Oracle workloads on-premise and in OCI, and a good number of version upgrades.
The documentation explains how each feature works. What it can’t do is tell you how to structure a site for your own estate – and those decisions are what make Checkmk easy or hard to run as it grows.
Three situations tend to bring people to this:
Coming from another tool. Standing Checkmk up from scratch after SolarWinds, PRTG or Nagios. The structural decisions in the first section are the ones to settle before you load a single host, because they are the expensive ones to change later.
Already running Checkmk. A site that has grown organically over several years and needs a tidy-up – classification that was never quite finished, thresholds set host by host, an alert volume nobody reads any more. Most of what follows reads as a list of things worth going back and fixing.
Scaling what you have. More sites, more hosts, more platforms. The folder structure, distributed setup and upgrade sections are where the return is.
Some of these are things we wish we’d known before our first implementation.
Here’s what matters.
Everything Flows From How You Configure Folders, Tags, Labels and Groups
If there’s one thing to take from this post, it’s that almost every capability in Checkmk is downstream of your folder, tagging, labelling and grouping decisions.
Consider what depends on that structure:
- Notification rules.
- Alert thresholds.
- Agent Bakery and plugin assignment.
- Views and Dashboards.
- BI Aggregates.
None of those are configured host by host in a well-run site. They’re configured against tags, labels and groups, and they inherit accordingly. Get the structure right and each of those layers becomes a handful of rules. Get it wrong and you’re maintaining exceptions forever.
One week spent getting the base configuration correct will save you weeks, if not months, of effort down the track. That isn’t an exaggeration – it’s the difference between adding a new host and having it correctly monitored, alerted and dashboarded automatically, versus adding a new host and then manually working through five separate configuration areas to make it behave like its neighbours.
It also lets you scale the size and complexity of your Checkmk environment without incurring additional management overhead. That’s the real prize. A well-structured site absorbs new hosts, new platforms and new customers without the administrative effort growing in step with the estate.
Folders Earn Their Place on Large Sites
Folders do more than organise the host list. Placing a host in a folder assigns that folder’s tags to it, which makes folder membership a classification mechanism in its own right and removes a whole category of per-host configuration. Add the host to the right folder and it inherits the tags, and everything downstream of those tags, automatically.
That matters most on large sites. Once an estate spans multiple customers, sites or platforms, a folder hierarchy that mirrors how the estate is actually organised lets you set the classification once per branch rather than once per host and it keeps that classification correct as hosts are added, moved and decommissioned.
The cost used to be navigation. A deep hierarchy meant working down through several levels of folder tree every time you needed a specific host. Checkmk 2.5’s search removes that, you can find a host directly without navigating the tree at all. The structure can now reflect how the estate is genuinely organised, rather than being flattened for the convenience of whoever has to find things in it.
Where the line sits depends on your environment. A small, homogeneous estate probably doesn’t need much of a hierarchy. A multi-customer, multi-site or multi-platform estate almost certainly does, and the larger it grows the more the inheritance saves you.
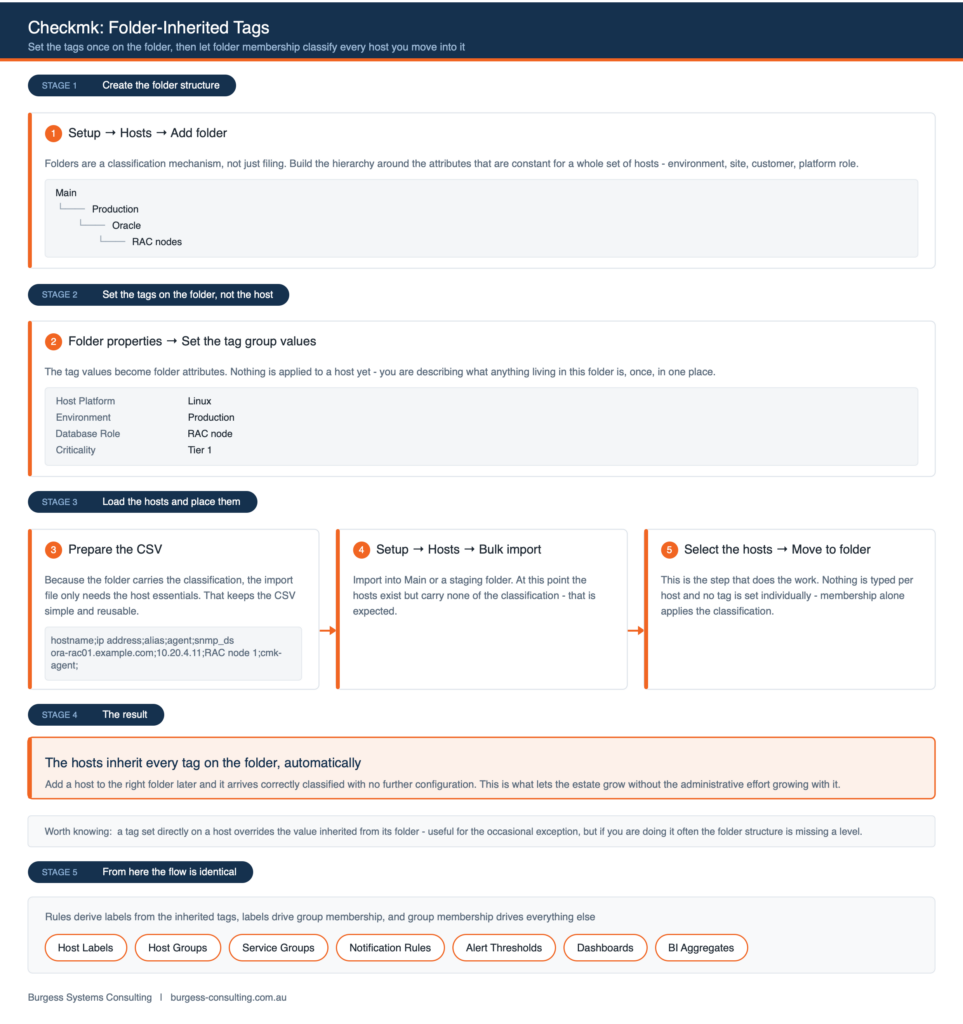
There’s a point at which folders make a great deal of sense, and where that point sits depends on your environment. A small, homogeneous estate probably doesn’t need them. A multi-customer, multi-site or multi-platform estate almost certainly does.
Greenfield: Do the Structural Work Before You Add Hosts
On a greenfield implementation the temptation is to start adding hosts immediately. Resist that urge. Hosts are easy to add and painful to restructure once rules have grown up around them.
Spend the time up front deciding how you’ll classify your estate. Which attributes actually matter – environment, location, application, business criticality, customer, platform? Those attributes become your tag groups, and you want them settled before hosts start arriving.
Work out how you’ll logically group hosts and critical services before they’re loaded into Checkmk, not after.
Know What You Can and Can’t Set at Registration Time
This is worth understanding before you plan your onboarding process, because it shapes how much work happens up front versus afterwards.
You cannot assign tags at the time of agent registration. Only labels can be set that way, via the --agent-labels parameter. If your intended classification depends on tags, agent registration alone won’t get you there.
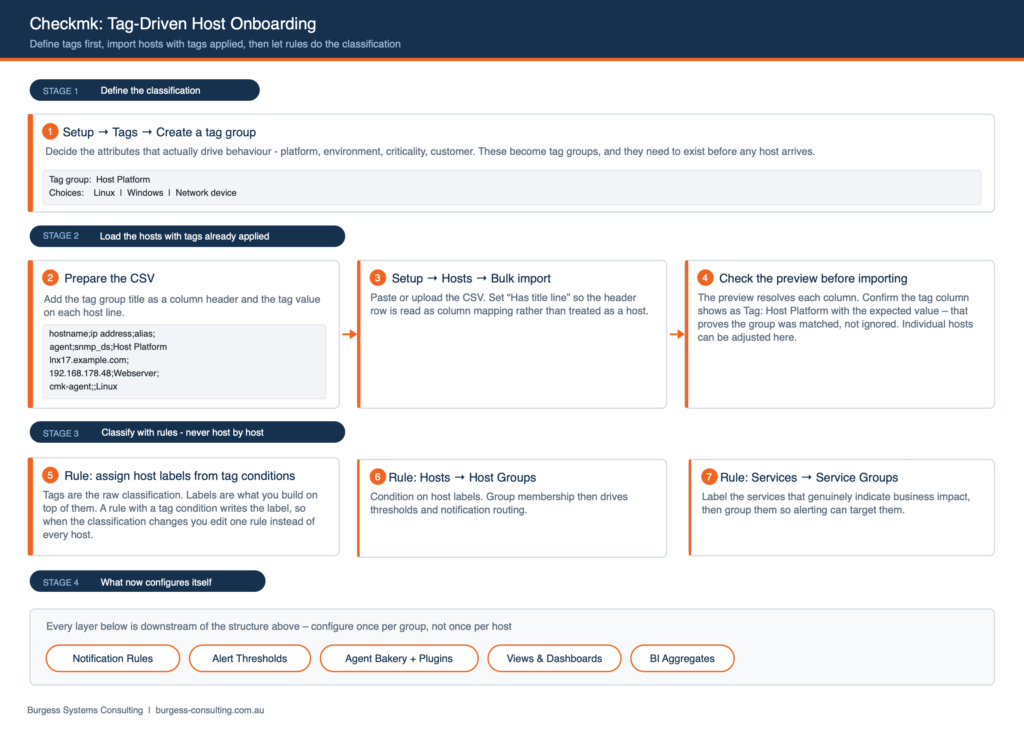
You can, however, assign tags when using bulk import via CSV file. This is the mechanism worth building your onboarding process around – prepare the CSV with the classification already decided, import, and the hosts arrive correctly tagged rather than needing a second pass.
The method is straightforward once you’ve seen it. Add the title of the tag group as an additional column in the header line, and the tag value as the corresponding field on each host line. Using our Host Platform tag group as the example:
hostname;ip address;alias;agent;snmp_ds;Host Platform
lnx17.example.com;192.168.178.48;Webserver;cmk-agent;;Linux
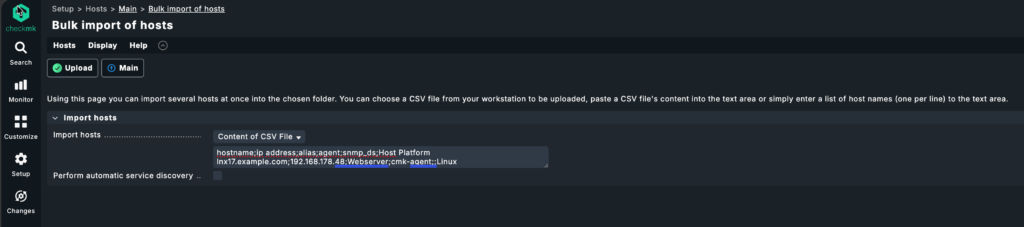
The final column header is the tag group title exactly as it appears in your tag configuration, and Linux is the tag value taken from that group’s list. Empty fields are fine where an attribute doesn’t apply – snmp_ds is left blank here because the host is monitored via the Checkmk agent.
Two things are worth knowing about the import itself. Set “Has title line” so Checkmk reads the header rather than treating it as a host, and then check the preview before committing. The preview resolves each column to what it will actually become – the Host Platform column is confirmed as Tag: Host Platform with a value of Linux – which tells you the tag group was matched correctly rather than silently ignored.
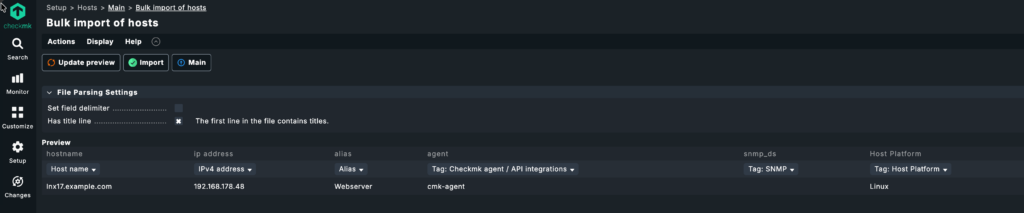
You can also change the tag on an individual host in the preview before importing. That’s useful for the inevitable handful of hosts that don’t fit the pattern of the CSV you’ve prepared, and it saves preparing a second file for the exceptions.
Use Combinations of Tags to Assign Host Labels
Tags are the raw classification. Labels are what you build on top of them.
A note on terminology before we go further: where this section refers to host labels, the same principle applies to service labels. Swap one for the other as your use case requires – the mechanics are the same, only the object being classified changes.
Use combinations of tags to assign host labels, then use host labels to assign hosts to host groups. That indirection is what gives you flexibility later – when the classification changes, you adjust the rule that derives the label rather than touching every host.
Notification rules then sit on top of host group and label conditions, with weighting applied where a particular group needs different escalation behaviour. Build the notification rules using host groups and labels, and avoid building them against individual hosts where it makes sense to do so.
That qualifier matters. If you only have one host of a particular device type, there’s no need to introduce the additional overhead of a group and label structure to serve a single object. Structure earns its place when it’s doing work for you across multiple hosts. Applying it dogmatically to one-offs is just ceremony.
Manage Alert Thresholds by Host Group and Label
This is the point that saves the most time in practice, and it’s worth stating plainly: alert thresholds can and should be managed by host group and label.
A development host and a production database host generally won’t carry the same CPU, memory or filesystem thresholds, and you should not be setting those thresholds individually. Define them once per group, let the label assignment put hosts in the right group, and the correct thresholds follow automatically.
The same applies to any parameter you’d otherwise be tempted to override on a single host. If you find yourself creating host-specific rules routinely, that’s a signal your tag and label structure is missing an attribute.
Label Your Critical Services, Then Group Them
Host-level structure is only half of it. Assign service labels to your critical services, and assign those critical services to service groups.
This matters because most estates have a small number of services that genuinely represent business impact, sitting inside a very large number of services that don’t. Without service-level classification you have no way to distinguish between them at the notification or dashboard layer.
Why do all this? It enables filtering of important events from noise. That’s the whole return on the investment. A flat Checkmk site with no classification strategy produces alerts nobody reads, and monitoring that nobody reads is worse than no monitoring, because it carries the appearance of coverage without the substance.
A Worked Example: Oracle Estates
For Oracle estates (or any database or application with a large number of monitored services) this is particularly worth the effort. Grouping database hosts by role and labelling the services that actually indicate database health gives you the ability to structure your monitoring around services that are critical to system health, as distinct from services that are important for database health. Ungrouped, an Oracle environment generates a very large volume of service checks with no signal hierarchy at all.
In practice, the structure we apply to an Oracle estate looks like this:
Tag groups capture the attributes that drive behaviour, database role (RAC or single instance, Data Guard primary or standby), environment (production, test, development), and the application the database serves. Folder placement handles the attributes that are constant for a whole set of hosts, so a host dropped into the production RAC folder inherits its role and environment tags without further configuration.
Host labels are derived from combinations of those tags, and drive host group membership. A production RAC node ends up in a host group that carries the thresholds appropriate to a clustered production database, which are usually not the thresholds you’d apply to a development standalone instance.
Service labels mark the checks that actually indicate database health, as distinct from the large volume of checks that merely indicate the host or database is alive. Tablespace utilisation, ASM disk group free space, Data Guard apply lag, listener availability and archive log destination status get labelled and grouped as critical. Oracle processes, undo utilisation and memory usage, whilst important to have visibility of, typically don’t result in a system down if they breach threshold. If a problem in those areas is causing system impact, it will usually be picked up by other checks anyway.
Notification rules then target the critical service group rather than the estate. The result is that an Oracle problem which matters triggers the correct notification method with the correct severity, and an Oracle check which merely changed state does not.
We also use this structure as the basis for our BI Aggregates, where the critical services across an application stack are represented in the aggregate and the appropriate notification methods configured. With that in place, a notification from a BI aggregate is a real problem that needs an appropriate response.
The difference this makes is not subtle. The same estate, monitored without that structure, produces alert volumes that make it very difficult to identify the problems through the noise.
Put Your Checkmk Configuration Under Git
Checkmk can track Setup configuration changes in Git, and it’s worth enabling.
The reason is rollback. If a configuration change causes a problem, reverting a commit is considerably easier than the alternative, which is a host-level or site-level restore. You also get an audit change history, which is useful well beyond incident recovery – it tells you who changed what and when, which becomes valuable the moment more than one person is administering the site.
This is close to zero effort to turn on and it pays for itself the first time you need it.
Tune Fetchers and Helpers to Match Your Workload
The default fetcher and helper configuration is a starting point, not a finished state.
How you tune it depends on where the work actually happens. The distribution of monitoring load between the network and the host influences the configuration significantly. An agent-based estate, where the monitoring load is incurred on the monitored host, has a very different profile to an SNMP-heavy estate, where fetchers spend most of their time waiting on network responses.
If your environment leans heavily on SNMP, the default helper counts may not serve you well. Look at your check latency and fetcher utilisation and tune from there rather than assuming the defaults are adequate.
Large Network Environments: Consider a Distributed Setup
For large network environments, consider a distributed setup with a dedicated VM per site – even where those sites sit within the same data centre.
The reason isn’t geographic separation, which is the usual argument for distributed monitoring. It’s that a dedicated site gives you a configuration boundary. You can tune the Checkmk configuration of each site to match the workload it’s actually monitoring, which is exactly what you want when one part of the estate is SNMP-heavy and another isn’t.
A single site tuned as a compromise between two very different workload profiles will underperform on both. Splitting them lets each be tuned properly.
Logwatch and the Event Console: Useful, But Not a Log Aggregator
Logwatch provides visibility into text log files, and that visibility is genuinely useful. It’s also frequently misunderstood, so the scope is worth being clear about: Logwatch does not behave like a log aggregator, and shouldn’t be deployed as one. The same applies to the Event Console, which handles syslog messages and SNMP traps through rule-based classification – powerful, but not a substitute for a log platform.
Where they earn their place is as a service within a site, used as an indicator of health that aggregates upward. Treated that way – as a signal source feeding your service and BI structure – they do a job nothing else in Checkmk does.
That job is closing a specific and important gap. Logwatch catches the situation where every platform service is reporting OK but the application is writing errors to its logfile that indicate a critical problem. The host is up, the listener is responding, the filesystem has space, and the application is failing. Nothing at the infrastructure layer will tell you that.
We rely on this mechanism heavily to detect problems before they become incidents. WebLogic managed server logs are the standard example – Java stack traces accumulating in a managed server log are frequently the earliest available signal that something is wrong, and they appear well before the platform-level checks notice anything. Monitoring those logfiles as a Checkmk service turns an application-layer failure into an alert you can act on rather than an outage you find out about from a user.
If what you actually need is log search, retention and correlation across an estate, run a log aggregation platform alongside Checkmk. Trying to make Logwatch fill that role produces a poor version of both capabilities. Use it for what it’s good at – early warning – and let a purpose-built platform handle bulk log analysis.
Upgrades: Small Steps, Verified at Each Level
Keep Checkmk updated. The procedure is simple and well-documented, and there’s little justification for running years behind.
That said, there are three details that turn a routine upgrade into a bad afternoon if you miss them.
Test on a Config-Only Copy First
If you have any hesitation about an upgrade, take a config-only copy of the site and run the upgrade against that before touching production.
A config-only copy gives you the thing that actually breaks during upgrades – your rules, custom checks and MKP extensions, custom notifications – without the historical performance data that makes a full copy slow to produce. You get a realistic rehearsal cheaply and can identify any compatibility issues up-front before touching production.
Don’t Skip Versions
When upgrading across multiple versions, don’t attempt to jump straight to the target version.
Start the site up at each incremental version level. Apply any outstanding configuration changes for that version. Let the application run for five to ten minutes before proceeding to the next upgrade. That pause isn’t superstition – it’s how you find out whether that version level is actually healthy before you stack another change on top of it.
Skipping intermediate versions works until it doesn’t, and when it fails you have no way to tell which version introduced the problem.
You’ll also find that later versions of Checkmk enforce a minimum source version before they’ll allow the upgrade to proceed. If you’ve fallen a long way behind, the sequential path isn’t merely advisable – it’s the only path available, and discovering that mid-maintenance-window is not the ideal time to find out.
Check the Site Default Version
Check the site default version when upgrading, and check it again when restoring.
This is a small thing that causes disproportionate confusion. A restore that lands on an unexpected default version produces behaviour that looks like a Checkmk fault and isn’t. Verify it explicitly rather than assuming.
The Bottom Line
The hard part is rarely the tool. It’s the structure underneath – sites where hosts were added before the classification existed, where thresholds are managed individually, where nothing distinguishes a critical service from a routine one, and where the resulting alert volume has trained everybody to ignore it.
The platform handles large, complex estates well. What determines whether an implementation succeeds is the discipline applied in the first week: folders and tags decided before hosts arrive, thresholds managed at group level, critical services labelled, configuration under version control.
Do that work up front and the platform starts working for you. Every host you add afterwards arrives correctly monitored, alerted and dashboarded without further effort. The tool is good, the effort is modest, and the return compounds for as long as the environment keeps growing.
Need help with Checkmk?
Whether you’re planning a greenfield Checkmk implementation, running a site that has grown beyond its original design, or monitoring Oracle workloads on-premise and in OCI – a 30-minute call is usually enough to assess your environment and work out the best path forward.
We are a Checkmk Gold Partner specialising in Checkmk and Oracle technologies, and we build and run these environments for our own customers. We also develop Checkmk for OCI, which brings native Oracle Cloud Infrastructure monitoring into an existing Checkmk instance.
Book a 30-Minute Call